


A modern triaxial vibration sensor samples at tens of thousands of samples per second. But when you evaluate it with ISO 10816 alone, all of that collapses into one number: the RMS velocity amplitude. Here's what that number leaves out — and why the high-frequency band and kurtosis warn you weeks earlier.
You're watching velocity. Here's what it hides.
The 10–1000 Hz velocity RMS behind an ISO 10816 "green" reading is band-limited by design — it's built for low-frequency severity. Every fault mode below lives (at least early) in the high-frequency band it filters out, so the dashboard stays green while the damage grows.
1The real signal
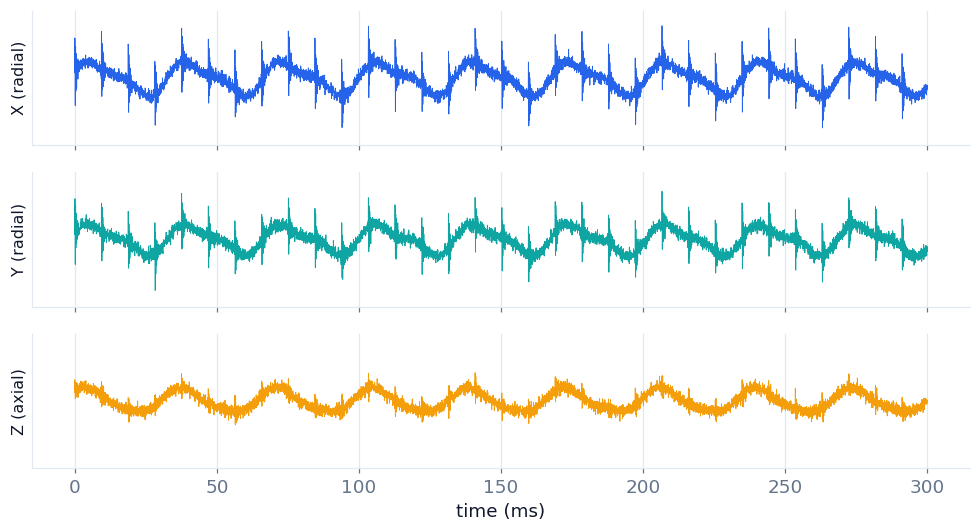
This is what the triaxial sensor actually measures: acceleration on all three axes (two radial, one axial). The bearing's periodic impacts are already there, in the raw signal. All the information exists.
2The ISO 10816 lensthe gap
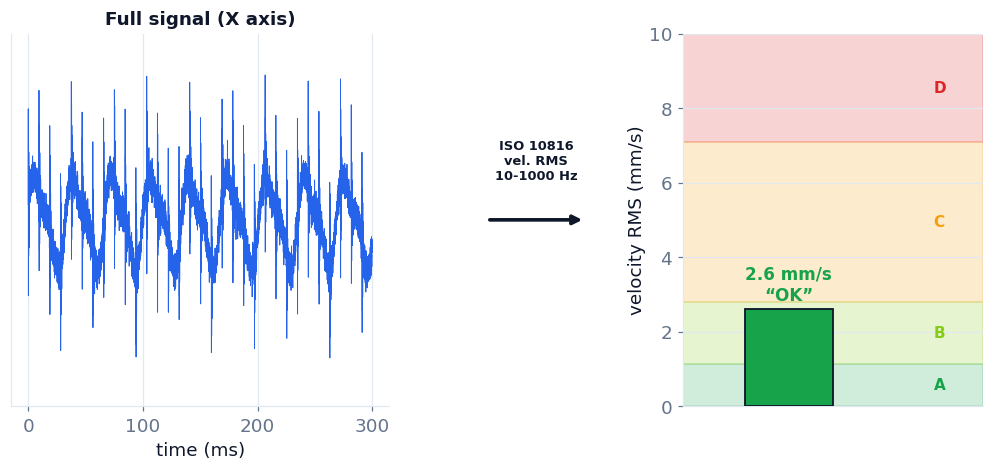
ISO 10816 integrates acceleration to velocity, band-limits it to 10–1000 Hz, and takes the RMS. Result: a single number. It lands in the green zone. It says "OK". ISO isn't wrong — it measures overall low-frequency severity (imbalance, misalignment, looseness). But it filters out exactly the band where the bearing lives, so the defect stays invisible.
3The same signal, in high frequencythe reveal
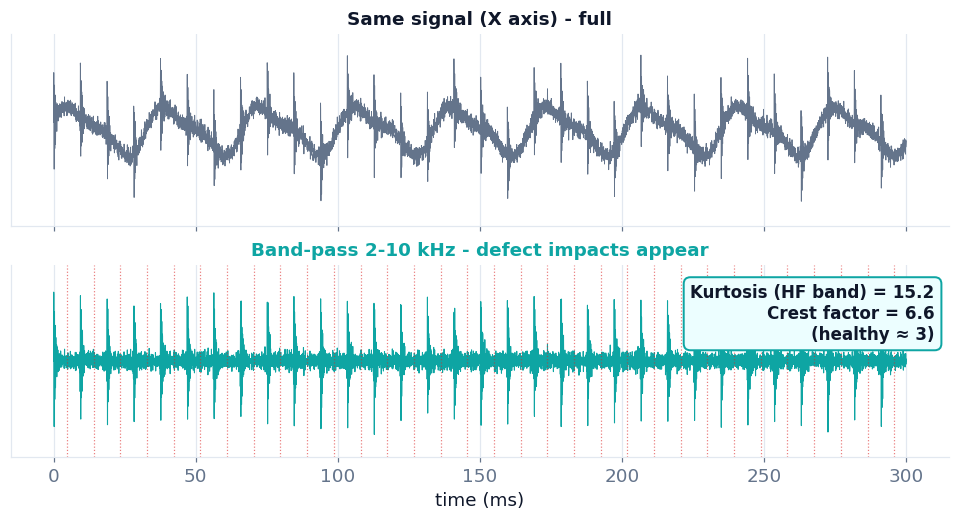
We take the same signal and band-pass it to 2–10 kHz. The defect impacts reappear, perfectly periodic. The kurtosis of this band jumps to 15.2 (a healthy signal sits near 3). The information was never lost — the average hid it.
4One signal, three lenses
The same triaxial measurement, seen three ways: velocity RMS (green, "OK"), the high-frequency band (visible impacts), and the shape indicators (kurtosis, crest factor). The sensor already delivers all three. What's missing is reading them together — and that's where one lens says "failing" while another still says green.
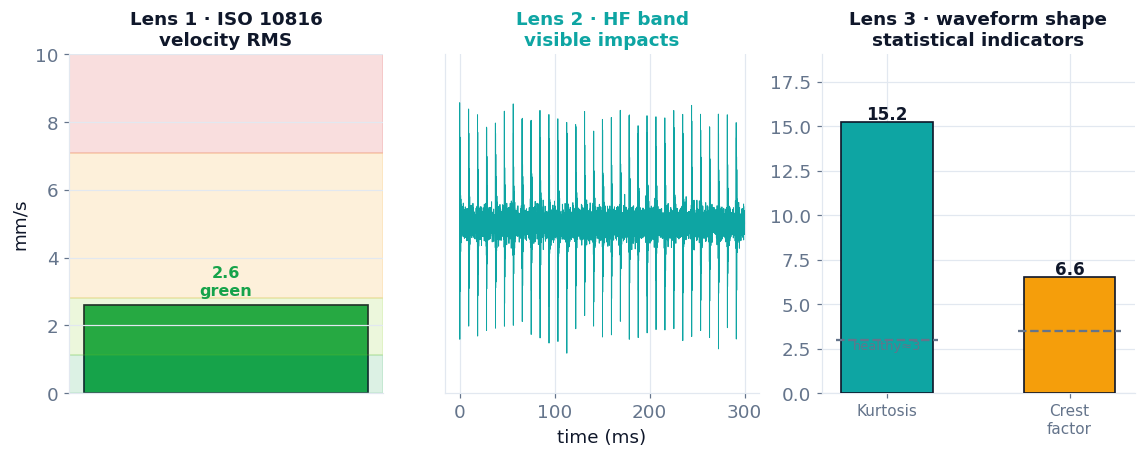
Charts generated from a simulated signal with real physics (defect impact exciting resonance; kurtosis and RMS velocity computed, not illustrative). · Wertek AI
What is kurtosis, in one sentence?
It measures how "peaky" a signal is versus a normal bell curve. A healthy bearing vibrates randomly (kurtosis ≈ 3). When a defect appears, the signal fills with sharp impacts and kurtosis rises. The elegant part: it's independent of amplitude and RPM — it detects that the shape changed, even while the overall level stays low.
Screen continuously, inspect the waveform on demand
This is the workflow, not a limitation. A fixed sensor delivers banded RMS and statistical scalars — it never records or transmits the raw waveform. Those scalars are enough for continuous early detection and trending: "this bearing is dying, weeks of lead time," which is most of the value. When a scalar or its trend crosses a threshold, Wertek raises an incident and can open a work order recommending a detailed waveform / route review — so you capture the full waveform, and identify the exact defect frequency (BPFO/BPFI/BSF/FTF), only when the screening says it's worth sending someone. Continuous = scalars; waveform = on demand.
Screening anticipates progressive faults with days-to-weeks of lead time; it is not a protection system for sudden, catastrophic failures. Dedicated electrical-fault diagnosis (e.g. rotor bars, stator) uses current signature (MCSA) or the VFD drive data, not the vibration scalar alone.
The difference isn't the sensor. It's who reads the signal.
Vibration hardware is good and honest: it reports velocity on all three axes, plus a high-frequency band, kurtosis and crest factor (on its primary radial axis), right on its datasheet. The market's blind spot is that almost everyone stops at the ISO velocity headline and leaves the high-frequency band and shape scalars as just another register. Wertek AI lands that same signal — from any compatible brand — in one place and interprets it together: velocity, high frequency, and waveform shape, on the asset it's actually talking about. The sensor reports it; we read it.