Your detector’s audio output
A heterodyne detector converts ultrasound into audible sound. Record that output and upload the file: WAV, MP3 or FLAC.



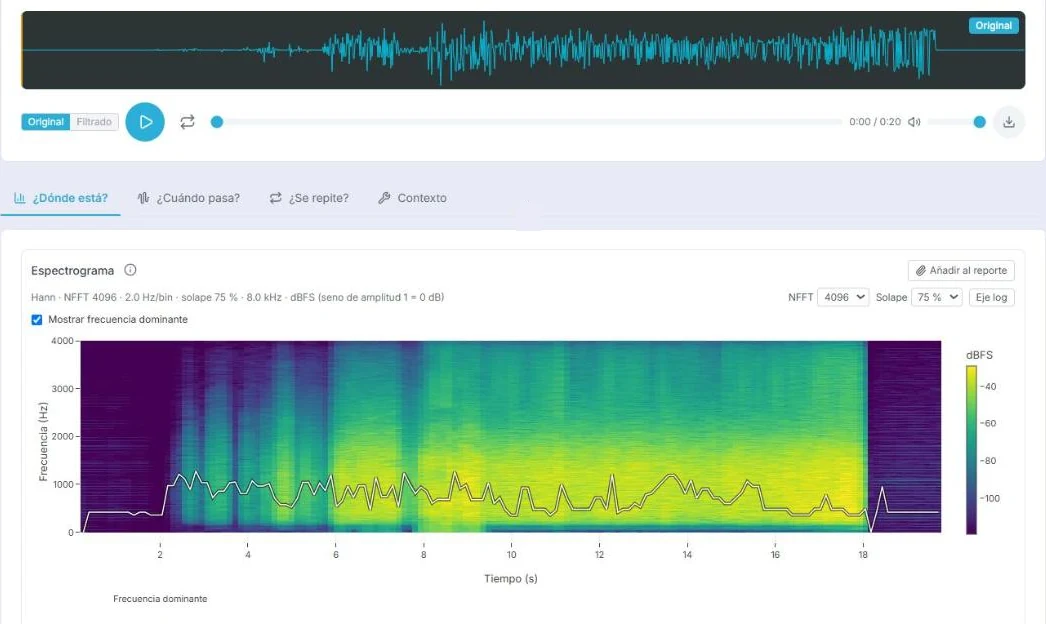
Upload the recording that came out of your ultrasound detector, or record with a phone. Wertek AI shows where the sound is, when it happens and whether it repeats; lets you filter it and listen; and keeps it in the asset’s history with its PDF report.
Start freeCreating an account and analysing your recordings costs nothing.
A heterodyne detector converts ultrasound into audible sound. Record that output and upload the file: WAV, MP3 or FLAC.
Record 2 to 60 seconds with the phone’s microphone, or with the detector plugged into its audio input. You can take a photo of what you measured: it is saved with the recording and shows on the web.
A phone microphone captures audible sound, not ultrasound. Every recording states how it was measured.
Your detector’s file from the web, or a new recording from the phone.
Every recording lives on its asset and states the method used to take it.
Pick a band and switch between Original and Filtered. The filter changes the view and the audio, never the measurement.
Good, possible fault or fault; before or after. Add the views that matter and get a PDF with the same numbers.
The spectrogram shows every frequency over time, with the average spectrum, the envelope and their peaks.
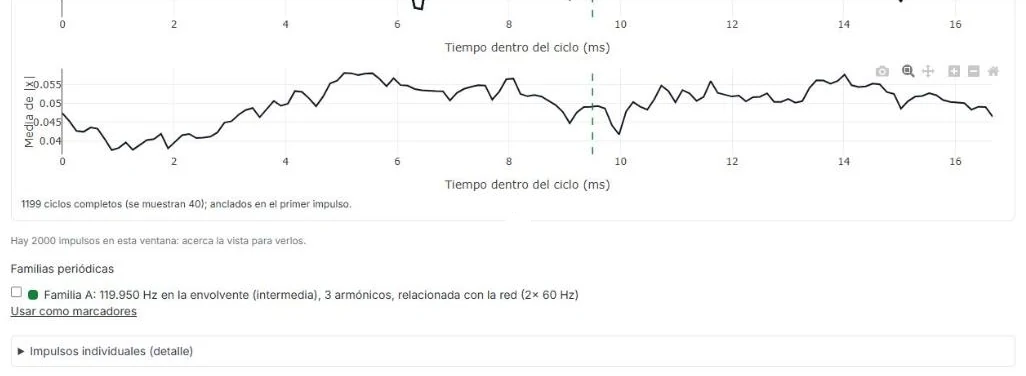
The analysis points out periodic families — rhythms that repeat — and whether they relate to the mains frequency. Or mark two impacts and read the interval and its frequency. With one or three cycles on screen, or with the cycles overlaid, you see how the pattern repeats.
The level along the recording: when it starts, how long it lasts and when it changes.
Every recording stays on its asset with its date, label and author. A new evaluation supersedes the previous one without deleting it.
One report per recording, or a work report with up to 30 recordings you select.
Open the asset in Studio: all its audio recordings and a suggested template to analyse them in Python, without leaving Wertek AI.
Every recording is linked to a Wertek AI asset. Scan its NFC tag or QR code with the phone and the asset opens, with what is already known about it in one place.